The ChemoSpec package carries out exploratory data analysis (EDA) on spectroscopic data. EDA is often described as “letting that data speak”, meaning that one studies various descriptive plots, carries out clustering (HCA) as well as dimension reduction (e.g. PCA), with the ultimate goal of finding any natural structure in the data.
As such, ChemoSpec does not feature any predictive modeling functions because other packages provide the necessary tools. I do however hear from users several times a year about how to interface a ChemoSpec object with these other packages, and it seems like a post about how to do this is overdue. I’ll illustrate how to carry out partial least squares (PLS) using data stored in a ChemoSpec object and the package chemometrics by Peter Filzmoser and Kurt Varmuza (Filzmoser and Varmuza 2017). One can also use the pls package (Mevik, Wehrens, and Liland 2020).
PLS is a technique related to regression and PCA that tries to develop a mathematical model between a matrix of sample vectors, in our case, spectra, and one or more separately measured dependent variables that describe the same samples (typically, chemical analyses). If one can develop a reliable model, then going forward one can measure the spectrum of a new sample and use the model to predict the value of the dependent variables, presumably saving time and money. This post will focus on interfacing ChemoSpec objects with the needed functions in chemometrics. I won’t cover how to evaluate and refine your model, but you can find plenty on this in Varmuza and Filzmoser (2009) chapter 4, along with further background (there’s a lot of math in there, but if you aren’t too keen on the math, gloss over it to get the other nuggets). Alternatively, take a look at the vignette that ships with chemometrics via browseVignettes("chemometrics").
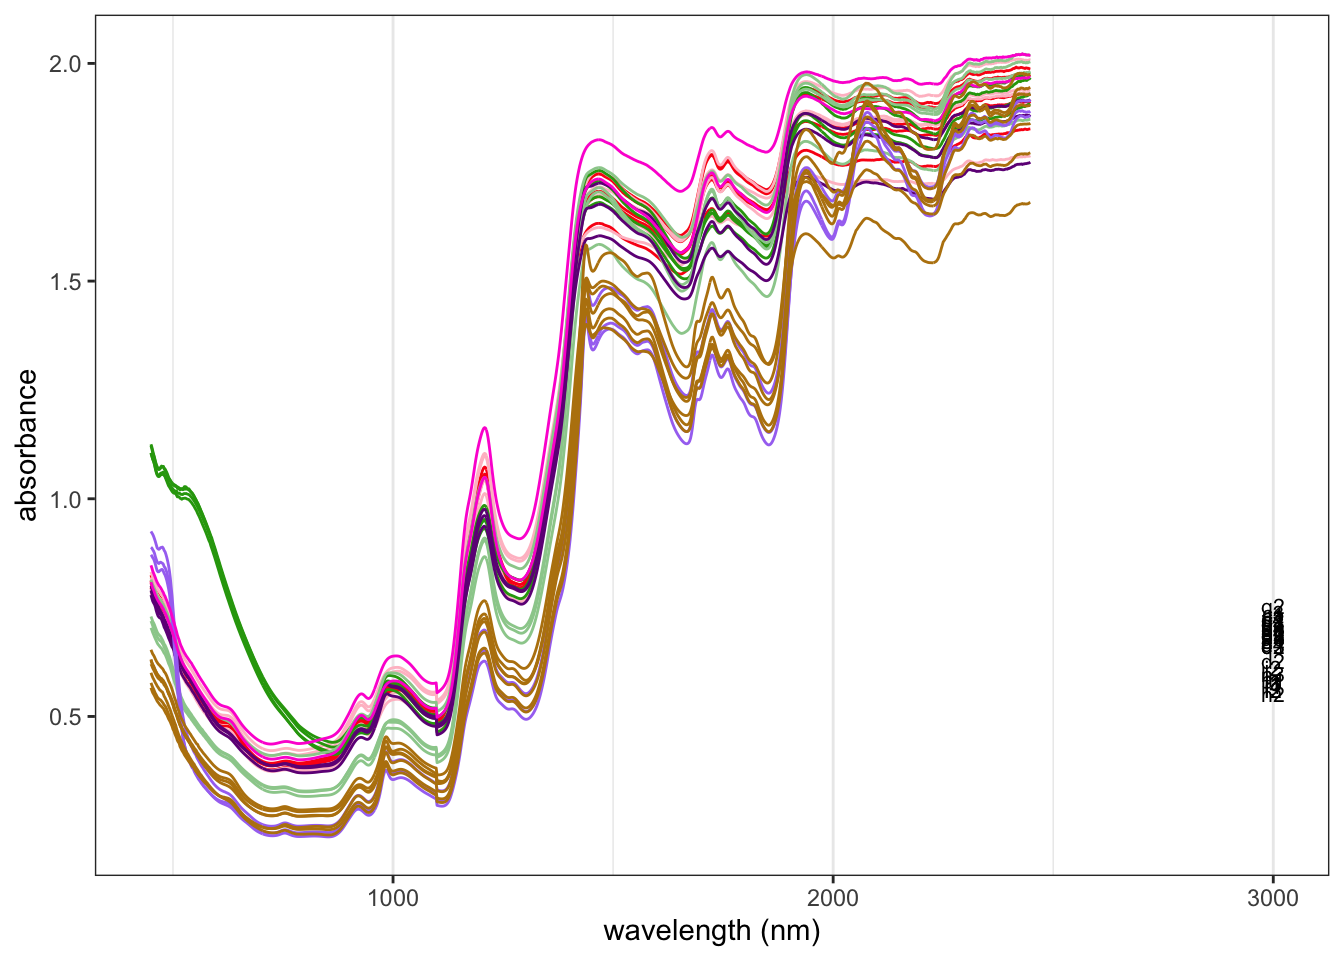
As our example we’ll use the marzipan NIR data set that one can download in Matlab format from here.1 The corresponding publication is (Christensen et al. 2004). This data set contains NIR spectra of marzipan candies made with different recipes and recorded using several different instruments, along with data about moisture and sugar content. We’ll use the data recorded on the NIRSystems 6500 instrument, covering the 400-2500 nm range. The following code chunk gives a summary of the data set and shows a plot of the data. Because we are focused on how to carry out PLS, we won’t worry about whether this data needs to be normalized or otherwise pre-processed (see the Christensen paper for lots of details).
library("ChemoSpec")
Loading required package: ChemoSpecUtils
As of version 6, ChemoSpec offers new graphics output options
For details, please see ?GraphicsOptions
The ChemoSpec graphics option is set to 'ggplot2'
To change it, do
    options(ChemoSpecGraphics = 'option'),
    where 'option' is one of 'base' or 'ggplot2' or'plotly'.
load("Marzipan.RData")sumSpectra(Marzipan)
 Marzipan NIR data set from www.models.life.ku.dk/Marzipan

    There are 32 spectra in this set.
    The y-axis unit is absorbance.

    The frequency scale runs from
    450 to 2448 wavelength (nm)
    There are 1000 frequency values.
    The frequency resolution is
    2 wavelength (nm)/point.


    The spectra are divided into 9 groups:

  group no.     color symbol alt.sym
1     a   5 #FB0D16FF      1       a
2     b   4 #FFC0CBFF     16       b
3     c   4 #2AA30DFF      2       c
4     d   4 #9BCD9BFF     17       d
5     e   3 #700D87FF      3       e
6     f   3 #A777F2FF      8       f
7     g   2 #FD16D4FF      4       g
8     h   3 #B9820DFF      5       h
9     i   4 #B9820DFF      5       i


*** Note: this is an S3 object
of class 'Spectra'
plotSpectra(Marzipan, which =1:32, lab.pos =3000)
In order to carry out PLS, one needs to provide a matrix of spectroscopic data, with samples in rows (let’s call it \(X\), you’ll see why in a moment). Fortunately this data is available directly from the ChemoSpec object as Marzipan$data.2 One also needs to provide a matrix of the additional dependent data (let’s call it \(Y\)). It is critical that the order of rows in \(Y\) correspond to the order of rows in the matrix of spectroscopic data, \(X\).
Since we are working in R we know there are a lot of ways to do most tasks. Likely you will have the additional data in a spreadsheet, so let’s see how to bring that into the workspace. You’ll need samples in rows, and variables in columns. For your sanity and error-avoidance, you should include a header of variable names and the names of the samples in the first column. Save the spreadsheet as a csv file. I did these steps using the sugar and moisture data from the original paper. Read the file in as follows.
The function we’ll be using wants a matrix as input, so convert the data frame that read.csv generates to a matrix. Note that we’ll select only the numeric variables on the fly, as unlike a data frame, a matrix can only be composed of one data type.
Now we are ready to carry out PLS. Since we have a multivariate \(Y\), we need to use the appropriate function (use pls1_nipals if your \(Y\) matrix is univariate).
library("chemometrics")
Loading required package: rpart
pls_out <-pls2_nipals(X = Marzipan$data, Y, a =5)
And we’re done! Be sure to take a look at str(pls_out) to see what you got back from the calculation. For the next steps in evaluating your model, see section 3.3 in the chemometrics vignette.
References
Christensen, Jakob, Lars Nørgaard, Hanne Heimdal, Joan Grønkjær Pedersen, and Søren Balling Engelsen. 2004. “Rapid Spectroscopic Analysis of Marzipan-Comparative Instrumentation.”Journal of Near Infrared Spectroscopy 12 (1): 63–75. https://doi.org/10.1255/jnirs.408.
Mevik, Bjørn-Helge, Ron Wehrens, and Kristian Hovde Liland. 2020. Pls: Partial Least Squares and Principal Component Regression. https://CRAN.R-project.org/package=pls.
Varmuza, K., and P. Filzmoser. 2009. Introduction to Multivariate Statistical Analysis in Chemometrics. CRC Press.
Footnotes
I have converted the data from Matlab to a ChemoSpec object; if anyone wants to know how to do this let me know and I’ll put up a post on that process.↩︎
str(Marzipan) will show you the structure of the ChemoSpec object (or in general, any R object). The official definition of a ChemoSpec object can be seen via ?Spectra.↩︎